


Shot Volume, Shot Making, and Kentucky's offense
There's more than one way to build a successful offense

I’ve been known to be a vocal critic of Kentucky’s offense on occasion. 2 years ago I wrote about the need for an offensive coordinator, and over the past few seasons I’ve written multiple different times highlighting offensive issues and suggesting fixes. To be fair, I’ve also written about the offense performing well!
“But Sean,” you might be thinking, “I know from reviewing KenPom.com and BartTorvik.com that Kentucky’s offense has been good the past 2 years!”
You are right! Per KenPom, Kentucky ranked 5th in 2022 and 17th in 2023 in adjusted offensive efficiency. Those are good rankings!
“So Sean,” you might follow, “how can you criticize an offense that is doing well?”
Because I think Kentucky’s offense can be significantly better, that’s why! The reason has to do with the concept of shot volume vs shot making, and the fact that Kentucky tends to excel at the former while falling behind on the latter.
What is Shot Volume?
I first came across the concept of “shot volume” through college basketball writer John Gasaway. The basic concept is calculating how many shots a team takes per 100 possessions, with turnovers reducing the number of shots and offensive rebounds increasing them. It’s usually calculated as FGA/(FGA + Turnovers - Offensive Rebounds) x 100. The numerator is scoring chances and the denominator is a crude estimation of possessions. I’ve always preferred shot volume scaled on a “per 100 possessions” basis so that it crucially is not affected by pace of play, but at how effective a team is at turning possession into a chance to score. It’s possible to have a shot volume index above 100 if a team records more offensive rebounds than turnovers.
Gasaway’s methodology ignored free throw attempts altogether, which I disagree with. A team who draws a lot of free throws should be increasing their shot volume by doing so; in fact, free throws are more productive than field goal attempts due to the higher percentage at which they’re made. I’ve adjusted the formula as follows:
Including free throw attemopts as scoring chances in the numerator by:
Accounting for the fact that a single free throw “possession” has multiple attempts; the common conversion is 0.475 FTA = 1 possession
Accounting for the higher rate of conversion on FTA; this varies year by year but FT% averages about 1.4x effective FG%
Including FTA in the possession denominator
My adjusted formula is (0.475 x FTA x 1.4 + FGA) / (FGA + 0.475 x FTA +Turnovers - Offensive Rebounds) x 100. Again the numerator is scoring chances and the denominator is possessions. For the 2023 season, the top 5 teams were:

Shot volume is really useful in having a good offense since it represents more chances to score. These teams ranked 11, 4, 17, 12, and 78th (sorry, Charleston) in KenPom’s adjusted offensive efficiency ratings. Shot volume isn’t what you typically think of with a good offense, however; that would be Shot Making.
What is Shot Making?
The whole point of offense is to put the orange ball through the hoop; that’s Shot Making. To better separate offense into volume vs shot making, I came up with a complement to Shot Volume to evaluate how well teams produced given the volume they created. Because the numerator of Shot Volume represents scoring chances, I can come up with an expected points per 100 possessions by multiplying scoring chances by effective field goal percentage. eFG% works because I scaled the volume of free throw attempts to be equivalent to a field goal attempt, and eFG% accounts for the value of three pointers vs two pointers. If I multiply Shot Volume by average eFG%, I get expected points per 100 possessions. I can compare that to a team’s actual points per 100 possessions to calculate how much more or less effective that team was at scoring from their attempts. The formula is:
Expected pts/100 = Shot Volume Index x Average eFG% x 2 points
Actual pts/100 = Pts For / (FGA + 0.475 x FTA + Turnovers - Offensive Rebounds)
Shot Making Index = Exp pts/100 - Act pts/100
Shot Making Index is pretty similar to True Shooting Percentage, although teams who score incredibly well or incredibly poorly from the free throw line will show up a little differently in SMI than TS%. Here are the top 5 in Shot Making Index for the 2023 season:
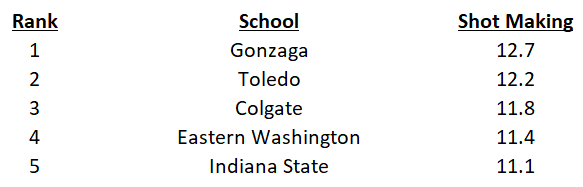
These teams all scored 11 to 13 more points per 100 possessions than you’d expect given their volume of shots. They ranked 1, 5, 43, 66, and 92nd in KenPom’s adjusted offensive efficiency. One important difference between my numbers and KenPom’s is that I’m not adjusting for opponents, which causes teams playing lesser competition to show up a bit better.
Most teams succeed at either Shot Volume or Shot Making but not both. In 2023 only 3 teams were in the top 40 in both metrics (Gonzaga, Toledo, UConn); those were 3 of the top 5 offenses in the country. Since 2010, between 1 and 7 teams finish in the top 40 in both metrics per season. Kentucky’s offensive philosophy is pretty clearly focused on Shot Volume, as I’m about to show.
Kentucky’s approach
Since John Calipari took the reigns Kentucky has had a pretty clear idea of what they want to do on offense: win on volume. Here’s their Shot Volume and Shot Making indicies by season, along with national rank:

Kentucky has been outside the top 40 in Shot Volume Index just 3 times in 14 years and they’ve been in the top 10 5 times. Conversely, their Shot Making Index has been in the top 40 just 1 time in those 14 years. In a wild coincidence, the one season where UK was in the top 40 in both metrics was the national title season of 2012, and their highest seeds and deepest tourney runs almost entirely came when in the top 60 in both stats. Looking at the above you can’t help but wonder what might have happened in 2016 with a little better defense; that UK team had one of Calipari’s best offenses.
This data means that Kentucky very rarely stands out for their efficiency in taking advantage of scoring chances, but they do an excellent job of generating more chances by either avoiding turnovers, grabbing their misses, or drawing a lot of free throws. This jives with more conventional stats, as UK is usually among the elite at offensive rebound or draeing free throws but rarely rates in the top 25 in effective FG%. When Kentucky has ranked highly in Shot Making Index, it’s usually not because of 3 point shooting but rather scoring at the rim. UK has ranked outside the top 100 in 3pt FG% in 11 of Calipari’s 14 seasons, but ranked in the top 15 in FG% at the rim in 2022, 2020, 2019, 2016, 2015, 2013 and 2012. That lines up pretty nicely with th effective Shot Making seasons above (FG% at the rim data from hoop-math.com, not available pre-2012).
The thing is, it doesn’t really have to be this way. UK takes a lot of midrange jumpers and doesn’t shoot very well on them (<40%). They take very few threes, and don’t do much in terms of modern concepts like spacing to create driving lanes. It’s not easy to incorporate these concepts and still collect offensive rebounds and avoid turnovers, but several other programs do it. Over the past 5 years, Villanova, Iowa, and Duke have all ranked in the top 40 in Shot Volume at least 3 times (like UK) and have avoided ranking below 150 in Shot Making in any season. In the past 5 seasons, Gonzaga has been in the top 50 in both metrics in 3 different seasons. Duke had a run from 2010 through 2020 where they never ranked below 80th in Shot Volume or Shot Making in ANY season, and were top 40 in both metrics 6 times. Toledo in on a run of three straight seasons ranking in the top 40 in both metrics.
Last season UK was 202nd in Shot Making, so they definitely didn’t make the most of their prodigious shot volume. If UK had been able to be 100th in Shot Making with a more efficient shot selection, their overall offense would have jumped from 17th in the nation to 5th. That would have put Kentucky roughly similar to Xavier, Baylor, and Gonzaga who all received 3 seeds in the NCAA Tourney. With an easier draw, maybe Kentucky makes a deeper run. Maybe some of the changes to the coaching staff will result in a fresh perspective and offensive philosophy, and UK can become the envy of their peers with an offense that wins in volume and efficiency. The very best offenses can do that….it’s time Kentucky tries too.