Are the Cats primed to be a tourney sleeper?
Are the Cats primed to be a tourney sleeper?
History shows that teams who fall from preseason top-5 have a tendency to overperform come tourney time

This is a guest post by Trent McBride. Follow him on Twitter @Trent_McBride!
You hear it every year. A team loaded with talent and potential disappoints and underperforms for four months, but then March begins and every analyst is tripping over themselves to remind you “Nobody wants to play this team in the tournament!” The 2014 Kentucky miracle run is still fresh in the memory.
But I’ve been skeptical. My personal bracket graveyard is littered with teams I thought were going to rise to the occasion, only to be upset on the first round (somehow, inexplicably, always by 3:00 the first day) or get run by 20+ in the second. I think of 2010 Texas, preseason top 5 in the AP and KenPom, started 15-0 and as late as January were ranked #1. Yet there they were with a 9-seed thanks to late-season mediocrity.
They lost in the first round to a very mediocre Wake Forest.
So when I hear the same chorus surrounding a somewhat resurgent UK team, it makes me a little nervous. And yet… preseason poll voters and prominent computer analysts started the season very high on the Cats, and provided they can get healthy over the next week, they do seem dangerous to make a deep run if matchups and shots fall just right.
Matchups and analysis of this team aside, I wanted to look to see if history is any guide. Do teams matching UK’s basic profile – preseason darling that flounders and falls deep in the seed lists – underperform or overperform (or, are they “who we thought they were”?) come tournament time. Were the 2014 ‘Cats the rule, or the exception?
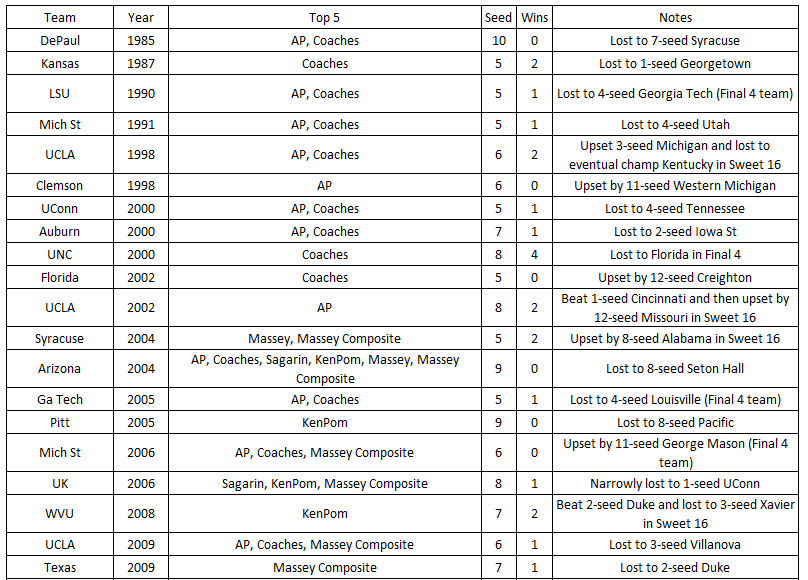
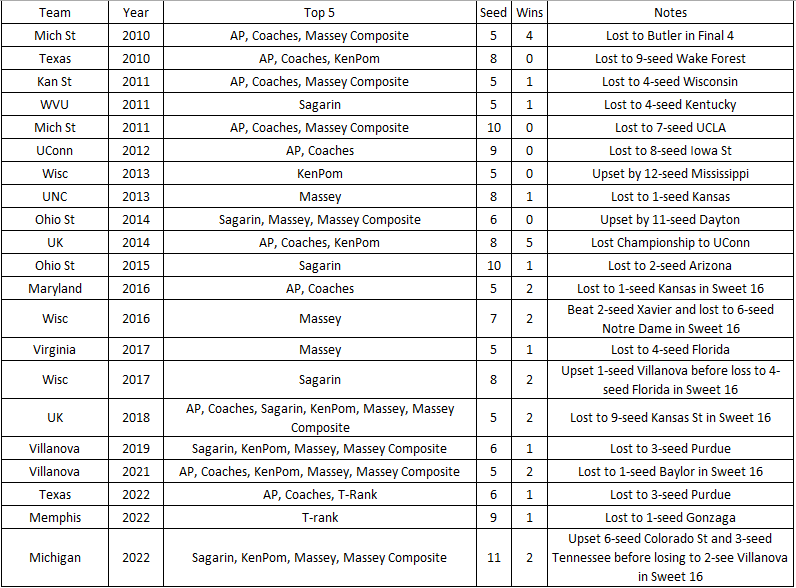
To start, I looked at all teams that were preseason top 5 in polls (AP or Coaches) or power rankings (KenPom, Sagarin, Massey, T-Rank, or Massey Composite) and subsequently fell out of the “protected” seed lines (5-11). How did they do compared to historic performance from those seed positions? Were these teams especially dangerous against top competitions? Were they apt to make deep runs?
Casting the net widely, I considered all teams that were top 5 in any of these rankings. Since 1985, when the tournament first expanded to 64 teams, there have been 41 such teams, approximately one every year. These included the aforementioned 2014 Kentucky and 2010 Texas teams; famous disappointments like preseason #1 and defending-champion 2012 UConn and 1990 LSU with Chris Jackson and Shaq; and 1-seed slayers 2002 UCLA and 2017 Wisconsin.
(Of note, UK makes two additional appearances: the disappointing 2006 team that was one possession away from picking off 1-seed UConn, and the 2018 team that let the most open path to the championship game in history slip through their fingers against Kansas State.)
Based on the weighted average of their seed strength, and those seeds’ historical results, you’d expect these 41 teams to win a total of 36-37 games, with less than 25% surviving the first weekend, and only one making it to the last; in fact, they’ve won 52 games (a whopping 40% more than expected), with over a third reaching the sweet 16, and 3 making the Final Four.
As is visible from the above, these teams overperform at every level of the tournament. They do very well in the first round, avoiding the 5-12 and 6-11 upsets (5 and 6 seeds were 17-5 in Round 1) as well as surviving the coin-flip 8-9 and 7-10 games (12-6 in these games). In the 2nd round, the 31 advancing teams have a losing record at 14-17; but this came against opponents that are almost always seeded higher (27 of 31 games). Remarkably, in 13 2nd round games as a 7-seed or worse against a 3-seed or better (games where the favorite would have at least a 2-1 betting advantage), the lower-seeded teams have a winning record at 7-6. In later rounds, these teams came back to earth against top seeds, but their overall record is still 11-13 against teams 4+ seeds higher.
Here is the overall record by opponent seed:
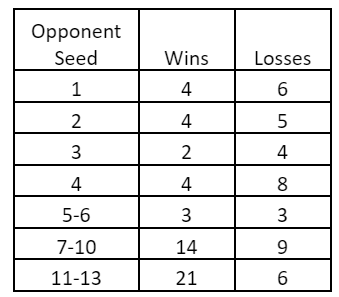
The overall record of these teams is 52-41, a 55.9% winning percentage. For context, this is better than the overall winning percentage of all 5-seeds in history (52.9%), but the median seed in this group is a 6 with an average of 6.8.
Three teams made it to the Final Four: 2000 North Carolina, 2010 Michigan State, and 2014 Kentucky, with UK advancing to the finals; both are higher than seed-expectations. It should be noted that these 3 Final Fours were some of the most unlikely groups in history, thanks in no small part to these three underachievers who crashed the party.
I performed a sensitivity analysis to see if these results were reliant on 1) severe under-seeding (or over-seeding of opponents, 2) breakdown of the brackets, 3) dilution/strengthening of the field by broadening/limiting the screen. None of these changed the results.
Finally, I looked to see if there were any trends with regard to whether these teams played better early in the season versus later; this was difficult to define and test, and doing so hacked up the data beyond recognition. It does appear that within this group, the vast majority faltered later in the season versus earlier. This probably contributed to the slight tendency for these teams to be under-seeded with respect to their strength. Given a historical committee bias in favor of teams playing well late, I imagine a lot of potential candidates were bumped into the 4-line and out of the sample.
Bottom line: should UK fall at or below the 5-line, as expected, history tells us they could indeed be a dangerous sleeper (note: this would also apply to Duke this year, as well), and a run to Final Four is not just wishful thinking. It seems there is some residual information in those preseason opinions and projections that is often uncovered come tournament time. Whether it be due to injuries, bad luck, or just plain inconsistency, these disappointing teams can be expected to exorcise their demons in the tourney more often than they extend their misery. Given the fairly even field this year, the set-up is ripe to see UK (and Duke) improve on this historical performance.
Thanks to Trent McBride for his terrific and insightful analysis! See below for the list of teams included in the sample.