

What Makes a Bad Matchup For UofL?
What Makes a Bad Matchup For UofL?

When the college basketball seasons turns into elimination tournaments, I like to start looking closer at matchups. Specifically, what qualities make for a bad matchup for UofL? While good and bad matchups aren't the be-all, end-all, there is some usefulness in taking lessons from the season and applying them to the postseason. Today, I'm going to look at what UofL's season so far tells us about what type of matchups are particularly bad for the Cardinals.
Which Stat Categories Have The Biggest Impact?
I like to look at how stats categories can provide insight on matchups, specifically by looking for stats which:
Had a strong relationship with UofL's game-by-game performance
How did game-to-game changes in a stat match up with UofL's adjusted margin game-to-game?
Had a strong relationship with the opponents' season-long performance in that stat
Did that stat get reliably better or worse when playing against teams who were better or worse in it over the season?
I'm focusing on "Four Factor" stats:
Effective FG%
Opponent effective FG%
Turnover %
Opponent turnover %
Free throw rate
Opponent free throw rate
Offensive rebound %
Defensive rebound %
I measured correlations between these stats in each UofL game and:
UofL's adjusted margin per possessions in each game
Each opponent's season-long performance in each stat
For example, on March 1 UofL had an eFG% of 51.8% against Virginia Tech, and on March 7th they had an eFG% of 46.1% against Virginia. UofL's adjusted margin was +0.32 per poss against Virginia Tech and +0.14 against Virginia, so the adjusted margin went down when effective FG% went down...that indicates that eFG% has some impact on adjusted margin. Virginia Tech allows opponents an eFG% of 48.5% this season and Virginia allows 43.1%, so this indicates that the opponent's performance this season had some impact on how they performed against UofL. I did this analysis for all 31 games and all 8 stat categories, and made a graph to show roughly how the stats compare in how they are impacted by opponent, and how they impacted UofL's performance:
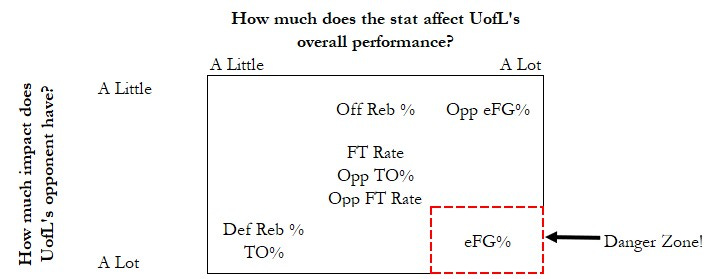
The two stats which correlated the most with UofL's performance were opponent eFG% and UofL's eFG%, while defensive rebounding and UofL's turnover rate had very little correlation.
I labeled the bottom right the "danger zone", because that's where you'll find stats which have the largest impact on UofL's performance and are also impacted by UofL's opponents. That is where we'd look to find stats which can lead us to bad matchups, and the stats that pops in that area is UofL's effective FG%.
The Best Teams Can Really Limit UofL
This season, Louisville's eFG% has been worse as they've played better defensive teams. There has been a notable dropoff in UofL's shooting when they play teams ranking in the top 100 in eFG% defense: Opponent rank in eFG% Defense UofL’s eFG% 200th or worse
58% 101st-199th 56% Top 100 46%
Opponents who performed well in eFG% over the season tended to keep it up when they played Louisville. It wasn't a perfect relationship, but it was a pretty reasonable pattern.
Meanwhile, you don't see such a dramatic pattern when looking at UofL's opponents' eFG%, which is impacted much less by the opponent's season long performance: Opponent rank in eFG% UofL’s opponent eFG% 200th or worse 43% 101st-199th 48% Top 100 46%
The opponent with the highest season-long eFG% of any UofL opponent this season was Michigan, and they had the lowest eFG% against UofL of any opponent! That's just one example, but it illustrates that shooting well on the season wasn't much of a predictor of how they'd do against UofL.
So we can generally say that opponents who are good at eFG% are going to give UofL trouble, and that hampers the Cards' ability to win. Why is this such a strong relationship? Is there anything more specific we can say about bad matchups?
The Key Is Matching Up With UofL Strengths
UofL tended to shoot worse against teams with good eFG% defense, but not always. What made the difference? The games that piqued my interest the most were the Duke and Georgia Tech games. Both rank in the top 25 in eFG% defense, and UofL played them back to back in January. The Cards had a 54% eFG% against Duke but only 46% vs Georgia Tech. It seemed reasonable at the time to think that the Cards had a letdown after a big win, but when UofL played Georgia Tech again in February they had an eFG% of only 37%. How was Georgia Tech so effective twice at holding UofL's offense in check, but Duke struggled in their matchup? I looked at data provided by Synergy which charts play types to see if there was a good explanation, and I found something interesting.
According to Synergy, UofL has 4 types of offensive actions which are very productive: spot up, transition, cut, and offensive rebound putbacks. UofL has an eFG% of 56% or greater on all of these, and is in the 95th percentile or better on spot up and transition offense. UofL is much less productive on post ups, pick-and-roll, isolation, and using screens; the Cards have an eFg% of 46% or worse on these actions. So, it's pretty clear what types of plays are most effective for UofL.
Then I looked at Georgia Tech and Duke to compare how they were at defending these play types:

While Georgia Tech and Duke are both excellent overall on defense, only Georgia Tech is excellent at the things UofL's offense is excellent at. Duke is in the 99th percentile in defending pick-and-roll ballhandlers, but that's not something UofL runs a lot or normally has a lot of success with. Virginia was able to have success limiting UofL in their most recent game, and the Cavaliers also rate very well in defending UofL's favorite actions. When defenses can take away UofL's favored offensive sets, they can have success.
A Few Bad Matchups Loom
Based on my analysis, it's probably fair to say that a team who is strong at defending UofL's preferred offensive actions is going to be a bad matchup. I looked for teams who meet the profile of Georgia Tech or Virginia, and found:
Michigan State
Florida State
West Virginia
Southern Cal
Stanford
Northern Kentucky
Some of these are likely to be high seeds, and some much lower, but they all are good at defending actions UofL relies on. These are teams UofL fans should not want to see in NCAA matchups.
On the flip side, there are some tourney-bound teams who are weaker in eFG% defense, or are strong on actions UofL doesn't use.This means that UofL may have a better opportunity to defeat them than they would against a stronger defensive team. Some good matchups are:
Dayton
Kansas
Creighton
BYU
Iowa
LSU
There's no guarantee UofL can beat these teams, but their defensive profile doesn't match up well with what UofL likes to run.
This time of the year, college basketball becomes all about matchups. You have to win each of your 6 matchups in a row in the tournament to be crowned national champion, and it doesn't matter how well you would have done against anyone else. Louisville fans should hope for matchups with teams who can't defend the stuff UofL prefers to run, because that seems to be the best path to Cardinal victory.
Thanks for reading my newsletter. For a primer on the stats I like to use, click here: http://hoopsinsight.com/stats-glossary. If you'd like to take a look at previous newsletters I've sent, check out my archive. If you have any questions, want to argue a point, or have some feedback, feel free to reach out via email at sean@hoopsinsight.com, or on Twitter @hoopsinsight. If you liked this, let me know as well, and tell your friends to subscribe at www.hoopsinsight.com.
You can forward this to others, but please ask them to subscribe as well so I can keep track of who's enjoying my insight and analysis.