

Coach Cal is right, UK should shoot fewer jumpers!
Coach Cal is right, UK should shoot fewer jumpers!

UK learned a new trick this season, hitting nearly 79% of their free throws after never hitting more than 74% under John Calipari. This has been particularly impactful for UK because they tend to draw a lot of free throws. This got me thinking, what are the stat categories where improvement can generate the most impact for UK? Because this article is a little longer and a bit more stats-y, I'm going to include the key takeaway here at the beginning...read more to see how I got there.
Takeaway: John Calipari came out this week and stated that he would like to see UK's guards drive more and settle for jumpers less. My analysis shows that reducing the number of 2 point jumpers UK shoots is the most impactful adjustment they can make, especially if it leads to shots at the rim for Nick Richards.
Picking the Stat Categories
First, I'm going to pick stat categories that are easily measurable and have public data. I pulled the data from KenPom.com and hoop-math.com, so thanks to them for having a ton of data available for every team in the country. Here are the stats I picked:
% of shots at the rim
% of shots as 2pt jumpers
% of shots as threes
Free throws per field goal attempt
FG% at the rim
FG% on 2pt jumpers
FG% from three
Free throw percentage
Defensive rebound rate
Offensive rebound rate
Turnover rate
Block rate
All of the above, but for opponents
That feels like a lot when I type it out like that. Hey, the more the merrier!
Defining Improvement
In another step to simplify things, I'm going to refer to Kentucky's rank in these categories by percentiles. For example, 95th percentile means that UK is better than 95% of the country; that ranks them about 18th or so. I decided to look at the impact of improving Kentucky's percentile ranking by 10; for example, going from 50th to 60th percentile.
One thing to consider is, because I'm using a 10 percentile improvement as the standard, anything where UK ranks at the 90th percentile or better is not eligible to be listed. That means FG% at the rim, free throw rate, free throw shooting %, opponent FG% on 2 point jumpers, and block rate are out, because UK is already elite at those.
Defining Impact
I decided to convert the improvement in a stat into points per game. For example, improvement in defensive rebounding reduces opponent's possessions, and I multiplied the reduction in possessions by the opponents' points per possession. I'm happy to share the formulas for everything if anyone wants it, but it's a lot.
Most stats are pretty straightforward, but there are a few exceptions. An increase in shots at the rim has to come at the expense of 2 points jumpers and threes, and an increase in free throws comes at the expense of field goal attempts.
In all cases, I left all of the other stats at UK's current season performance when calculating the effect of improvement. So, what are the results?
Shot Location is where UK can improve the most

The stat where a 10 percentile improvement will have the most impact for UK is decreasing the frequency with which they shoot 2 point jumpers. UK is in the 2nd percentile nationally, meaning they shoot a lot of them, and a 10 percentile improvement would mean they go from taking 41% of their shots there to just 33%. That would be worth 2 points per game, assuming they increase their shots at the rim and from three proportionally. This is because UK shoots just 36% on these jumpers, but 68% at the rim and 33% from 3. If UK trades some jumpers for other shots, they are trading 0.72 points per shot (36% x 2 pts) for 1.36 (68% x 2) or 0.99 (33% x3). That's simple math, and it's an especially good trade for UK because the Cats are one of the best teams in the country in FG% at the rim (97th percentile). I'm not including drawing more free throws in this math, either...that would be a larger benefit, because I suspect UK would draw more fouls close to the rim than on 2 point jumpers.
That stat is more than twice as impactful as the #2 stat, the frequency that opponents shoot near the rim. UK is quite good, ranking in the 89th percentile, but moving up to the 99th percentile would improve UK by almost 1 point per game. The math is similar to the previous example, as taking opponents away from a place where they shoot 59% to a place where they shoot 28% (jumpers) or 29% (from three) is a good move. However, the 10 percentile improvement only takes it from 32% of shots to 29%...that's a considerably smaller move than the #1 stat. More on that in a second.
Improving UK's offensive rebounding, forcing opponents into more 2 point jumpers, and becoming stingier on opponent shots near the rim round out the top 5. #3 and #4 are particularly interesting because the magnitude of improvement isn't very big, but they both lean into something UK does very well. Getting more offensive rebounds allows UK to have another possession, and UK is in the 93rd percentile nationally in offensive points per possession. If UK was a worse offensive team, an offensive rebound would be worth less to them. Similarly, forcing more opponent 2 point jumpers is an especially good thing for UK because the Cats are in the 99th percentile in opponent FG% on them. If UK wasn't good at defending them, forcing 2 point jumpers would have little value.
This is why a stat like forcing a turnover isn't as big of a deal for UK. The Cats are good enough on defense that they can limit opponent scoring without turnovers. If UK was horrible in halfcourt defense, forcing a turnover would be a huge deal because the opponent would be more likely to score without one.
Improvement is most important at the extremes
The fact that by far UK's most impactful improvement would come in a stat where they are among the nation's worst is not a coincidence. The fact is that the biggest impact from improving a few spots in a stat ranking is always going to come at either extreme: the very best or very worst. It's because most team stats in college basketball tend to follow a specific distribution pattern where there's a big dropoff among the top or bottom handful of teams. Just look at 2 examples:

The nation's leader in offensive rebound rate is West Virginia at 40.4%. The gap between them and 10th place Duke is 4.6%; that's the same as the gap between Duke and Kansas, who ranks 73rd. In percentile terms, moving about 3 percentiles from Duke to West Virginia would yield a similar improvement to move 18 percentile points from Kansas to Duke.
You'll see a similar distribution in other, unrelated stats. For example, here's opponent FG% at the rim:
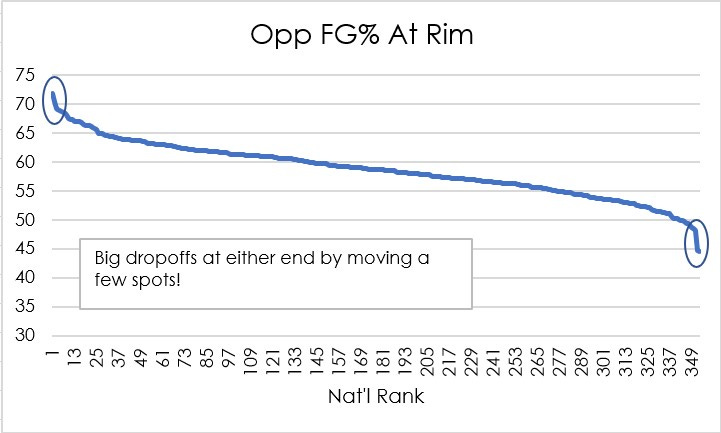
With these stats (and most other team stats), you're going to see a similar pattern. Improving from being in the top 5% of something to the top 1% is a bigger deal than improving from the top 15% to the top 5%. The takeaway is that it's a huge advantage to be among the very best handful of teams in the country at something, and not be among the very worst.
What should Kentucky do?
UK's coaching staff should focus on tweaking offensive sets to de-emphasize 2 point jumpers. Calipari himself stated a desire to see his team take fewer jumpers are draw more fouls. I didn't include the benefit of drawing more fouls in my analysis, and that would help, but there's actually a weapon UK has that's even better.
An offensive tweak should focus on generating more shots at the rim, where UK has been elite as a team (97th percentile). They should focus their energy on creating these opportunities for Nick Richards, who ranks 1st in the nation at FG% at the rim (minimum 50 attempts) at a stunning 88%! A Nick Richards shot near the rim is a better option for UK than anything but Immanuel Quickley shooting free throws. But it gets even better...
The best way to generate shots near the basket for Richards is to play him alongside 3 guards and Keion Brooks. While Richards takes 68% of his shots in the paint and hits 82% normally, this jumps to 75% at 93% accuracy when the floor is spread for him. That 93% is even better than Immanuel Quickley shooting free throws! However, Richards takes then Maxey, Brooks, or Quickley in these situations. UK needs to feed him the ball when they spread the floor.
Richards is a huge threat on the weakside block when one of UK's guards drives, as he will usually finish or draw a foul (or both) if the guards can drive and find him. UK should look at how they ran these sets against Georgia Tech, where Richards was 3-3 in the paint with these lineups, or in the home game against Georgia, where he was 4-4.
The good news is Calipari has publicly acknowledged a desire to spread the floor more and let the guards drive to the basket. If this results in more free throws or more shots for Nick Richards near the rim, this should give UK a huge boost.
I want to thank you for subscribing to my newsletter. At Hoops Insight, I hope to use data to find insights that reveal things you didn't realize about the Kentucky Wildcats. I'm using play-by-play data to track what's happening, who's doing it, and who is in the game, in order to show you things the box score can't. Check out my past newsletters in the Hoops Insight Archive, and read about the stats I like to use in my stats glossary.
If you have any questions about things I'm saying, the data behind it, or if you just want to debate a point, feel free to contact me on Twitter at @hoopsinsights or email at sean@hoopsinsight.com. I'd love your feedback on the newsletter and how I can improve. Thanks, and I hope you enjoy my work.